Here are a few projects that focus on a range of topics from data visualization for gaining big picture insights to transactional interfaces for completing a procedural task.
Manager Hub
Type: Dashboard/ Hub
Role: Interaction Design
Industry: Human capital management
Company: UKG
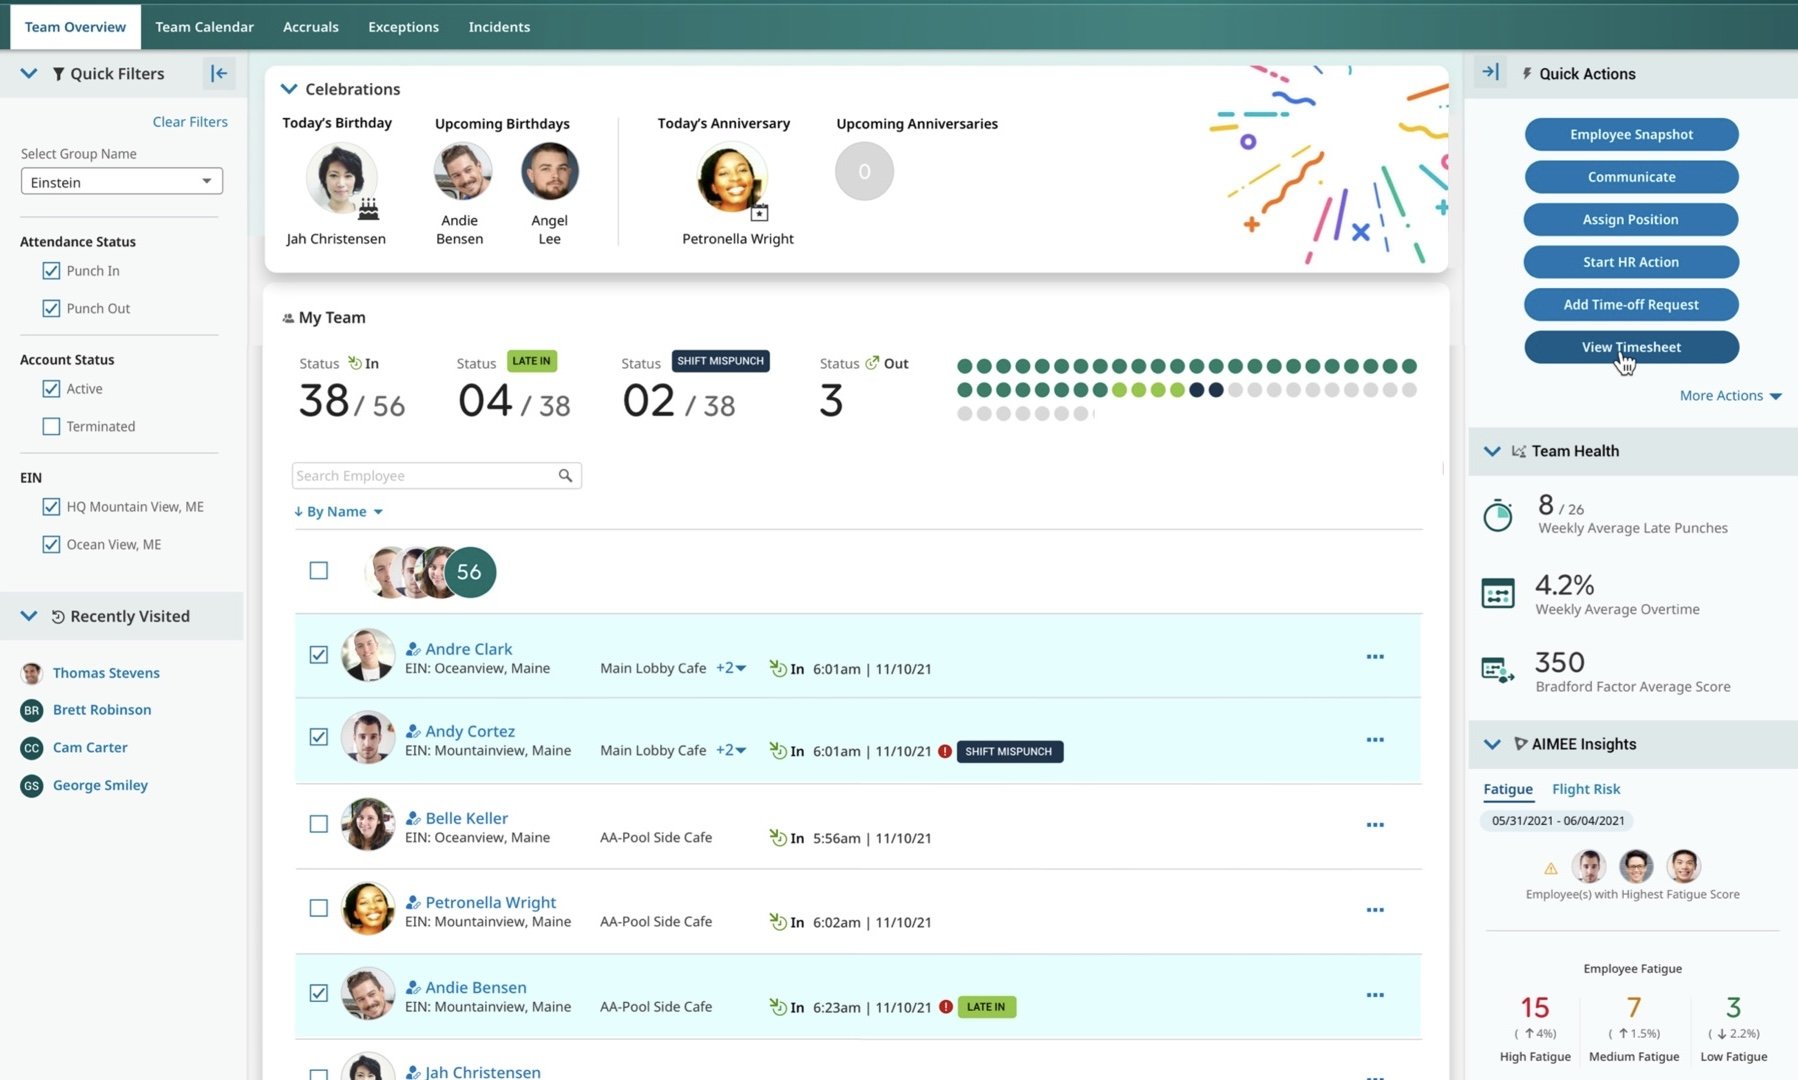
Designed a hub for managers to easily monitor employee shifts, punches and other activity.
Outcome: Managers are able to easily follow up on employee statuses, punches, time-off requests and gain insights on overall team health. The dashboard is also helpful in filtering teams based on cost-centers and locations for selective monitoring.
Tools used: Figma


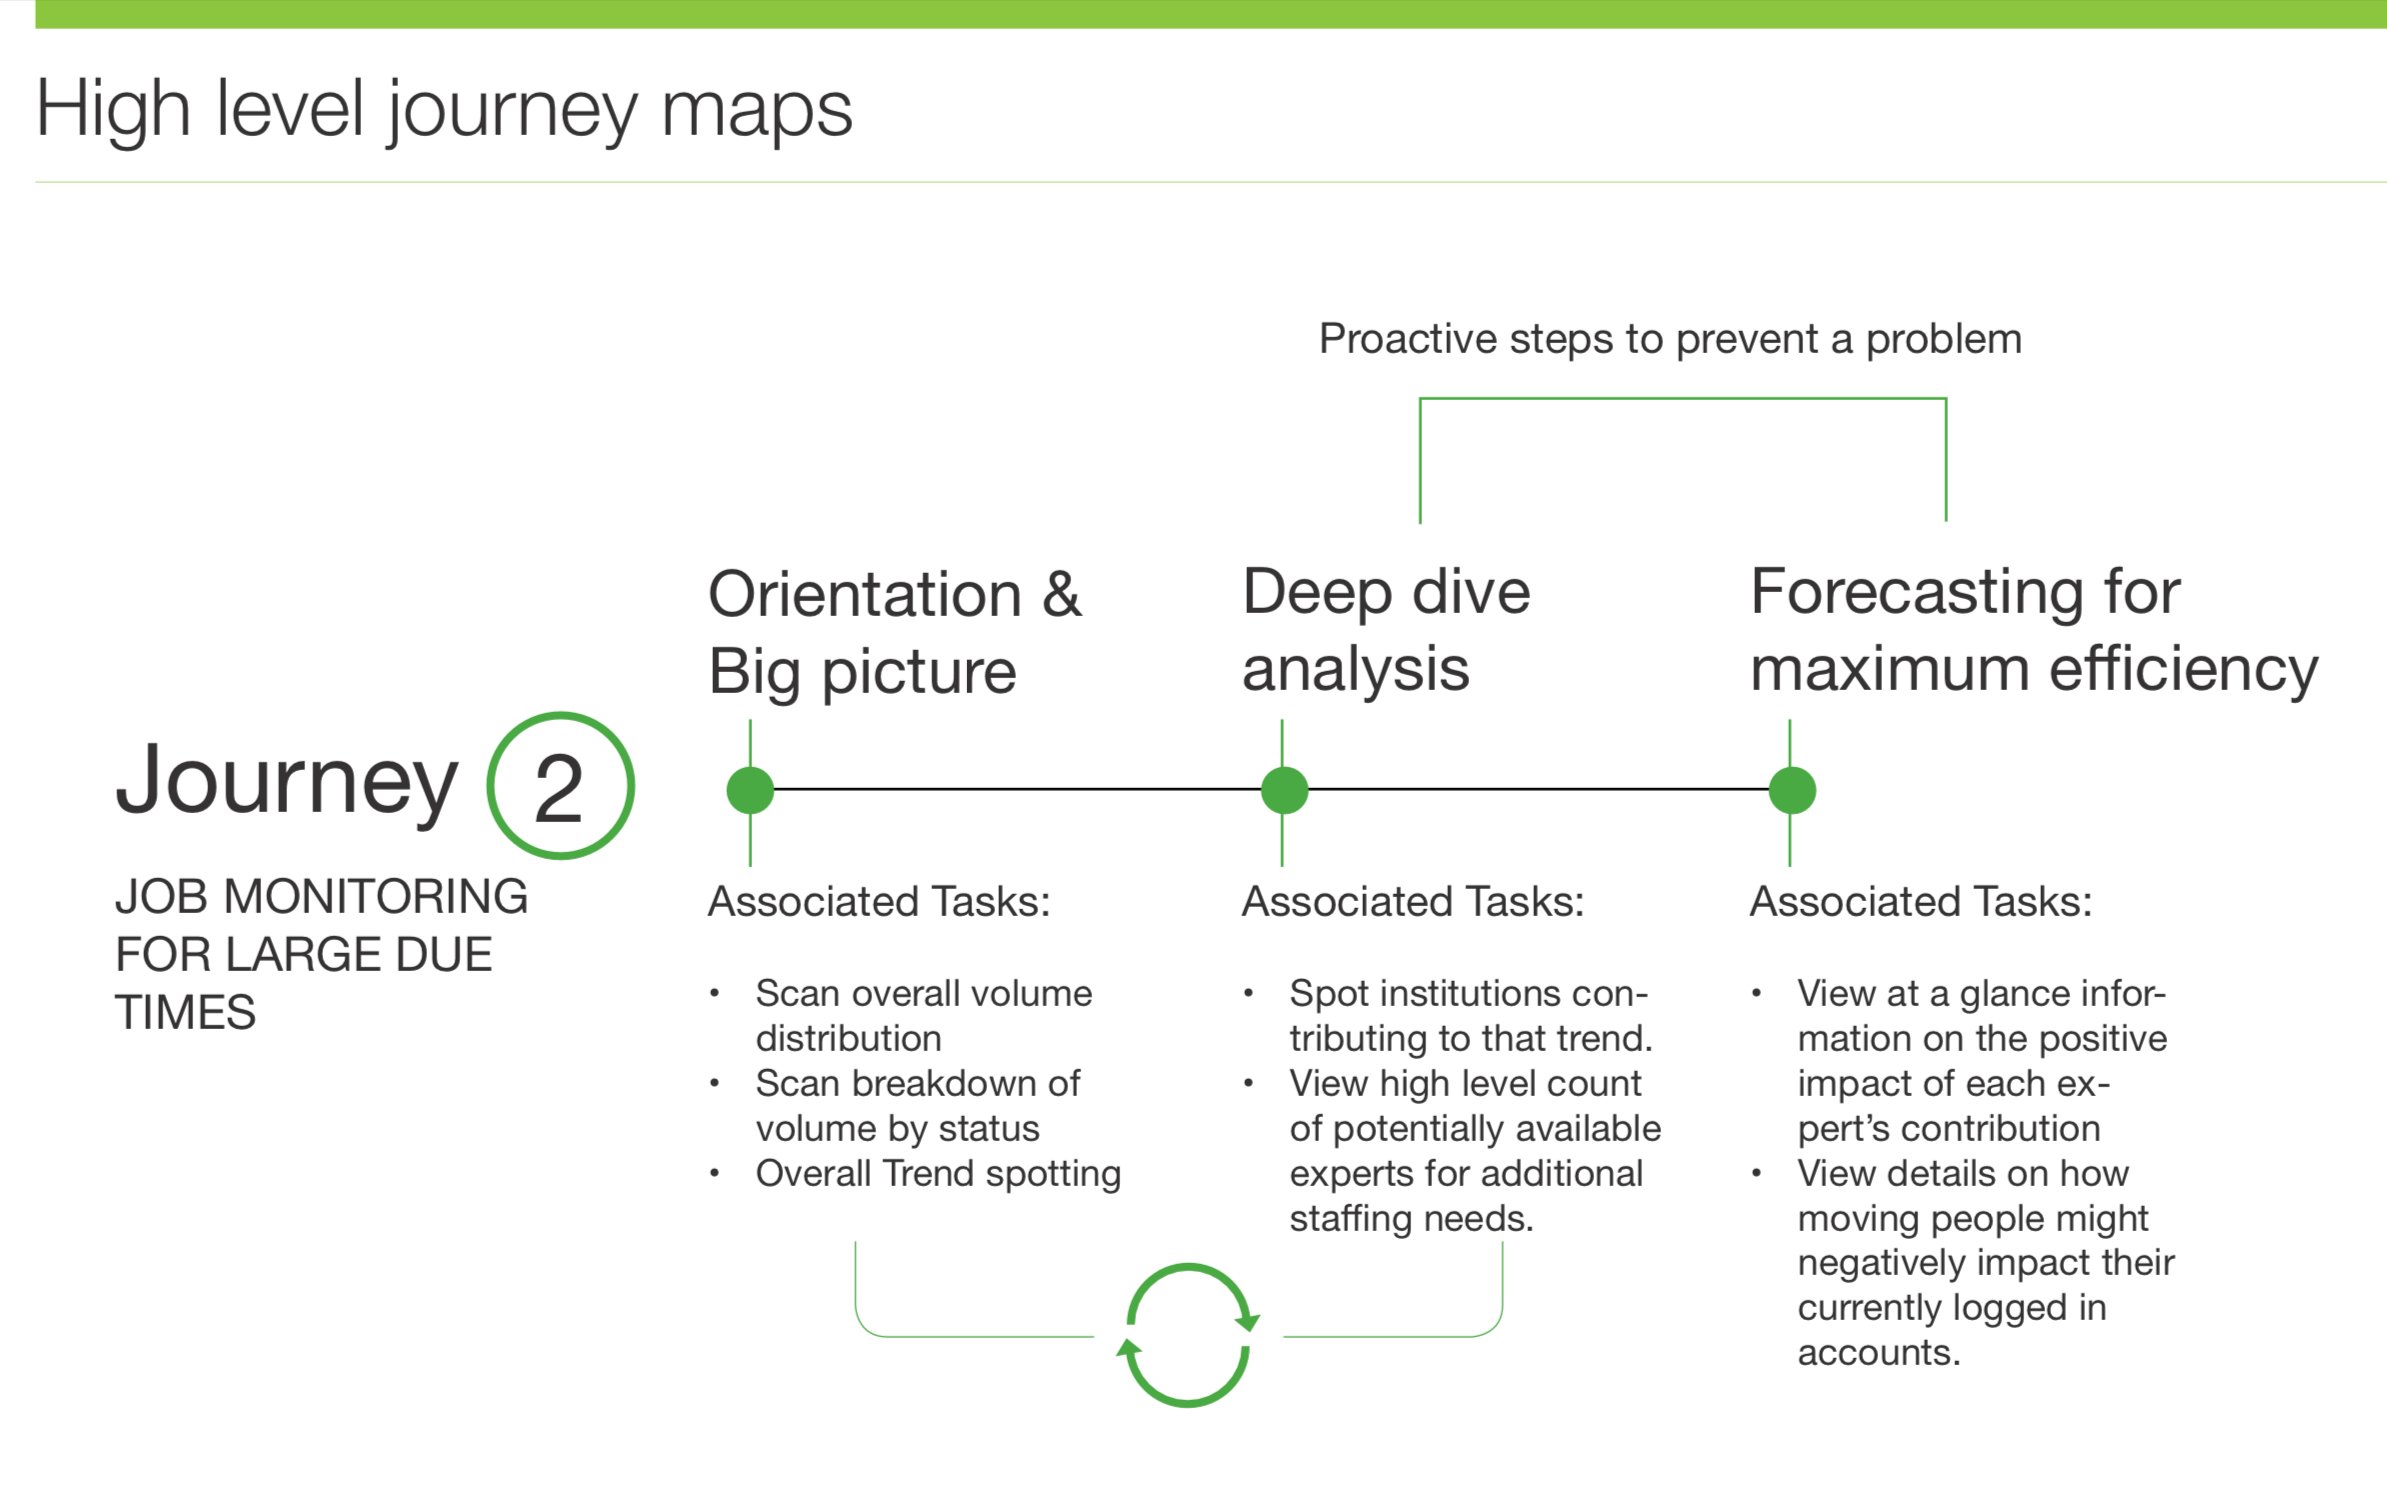
Transcription Monitor
Type: Data visualization, Dashboard
Role: User Research, Interaction Design
Industry: Healthcare
Company: Nuance Communications
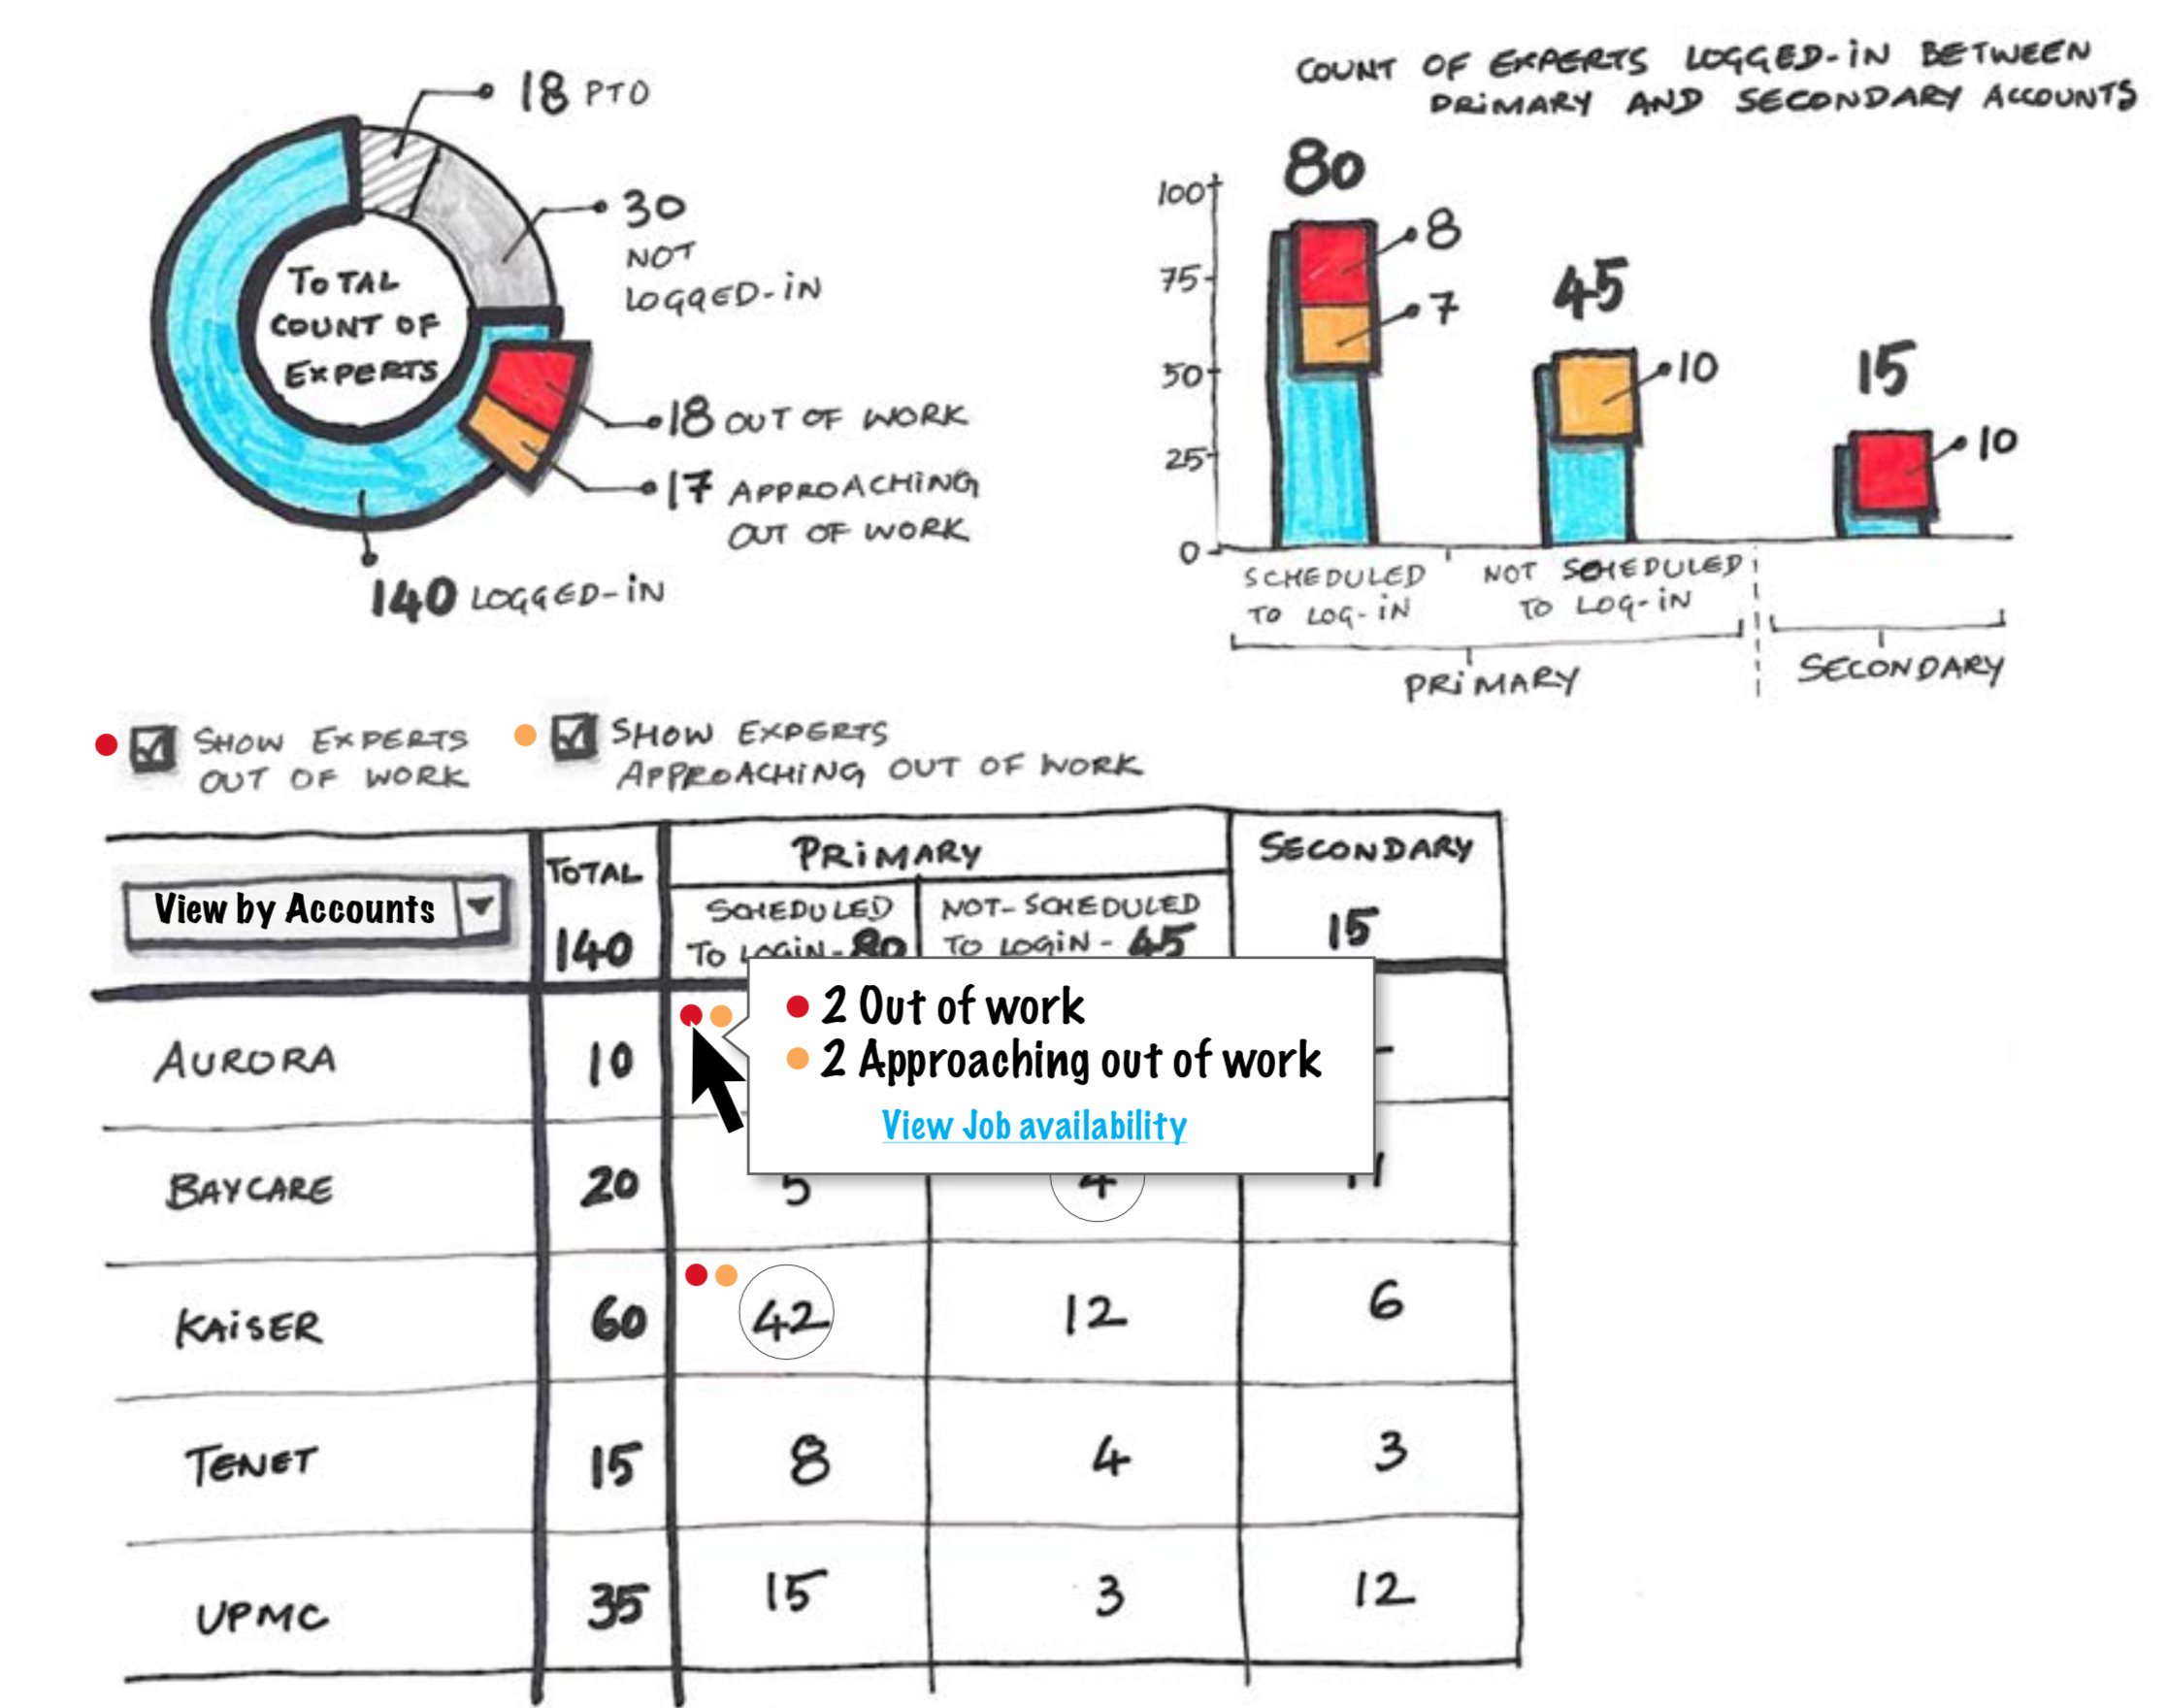
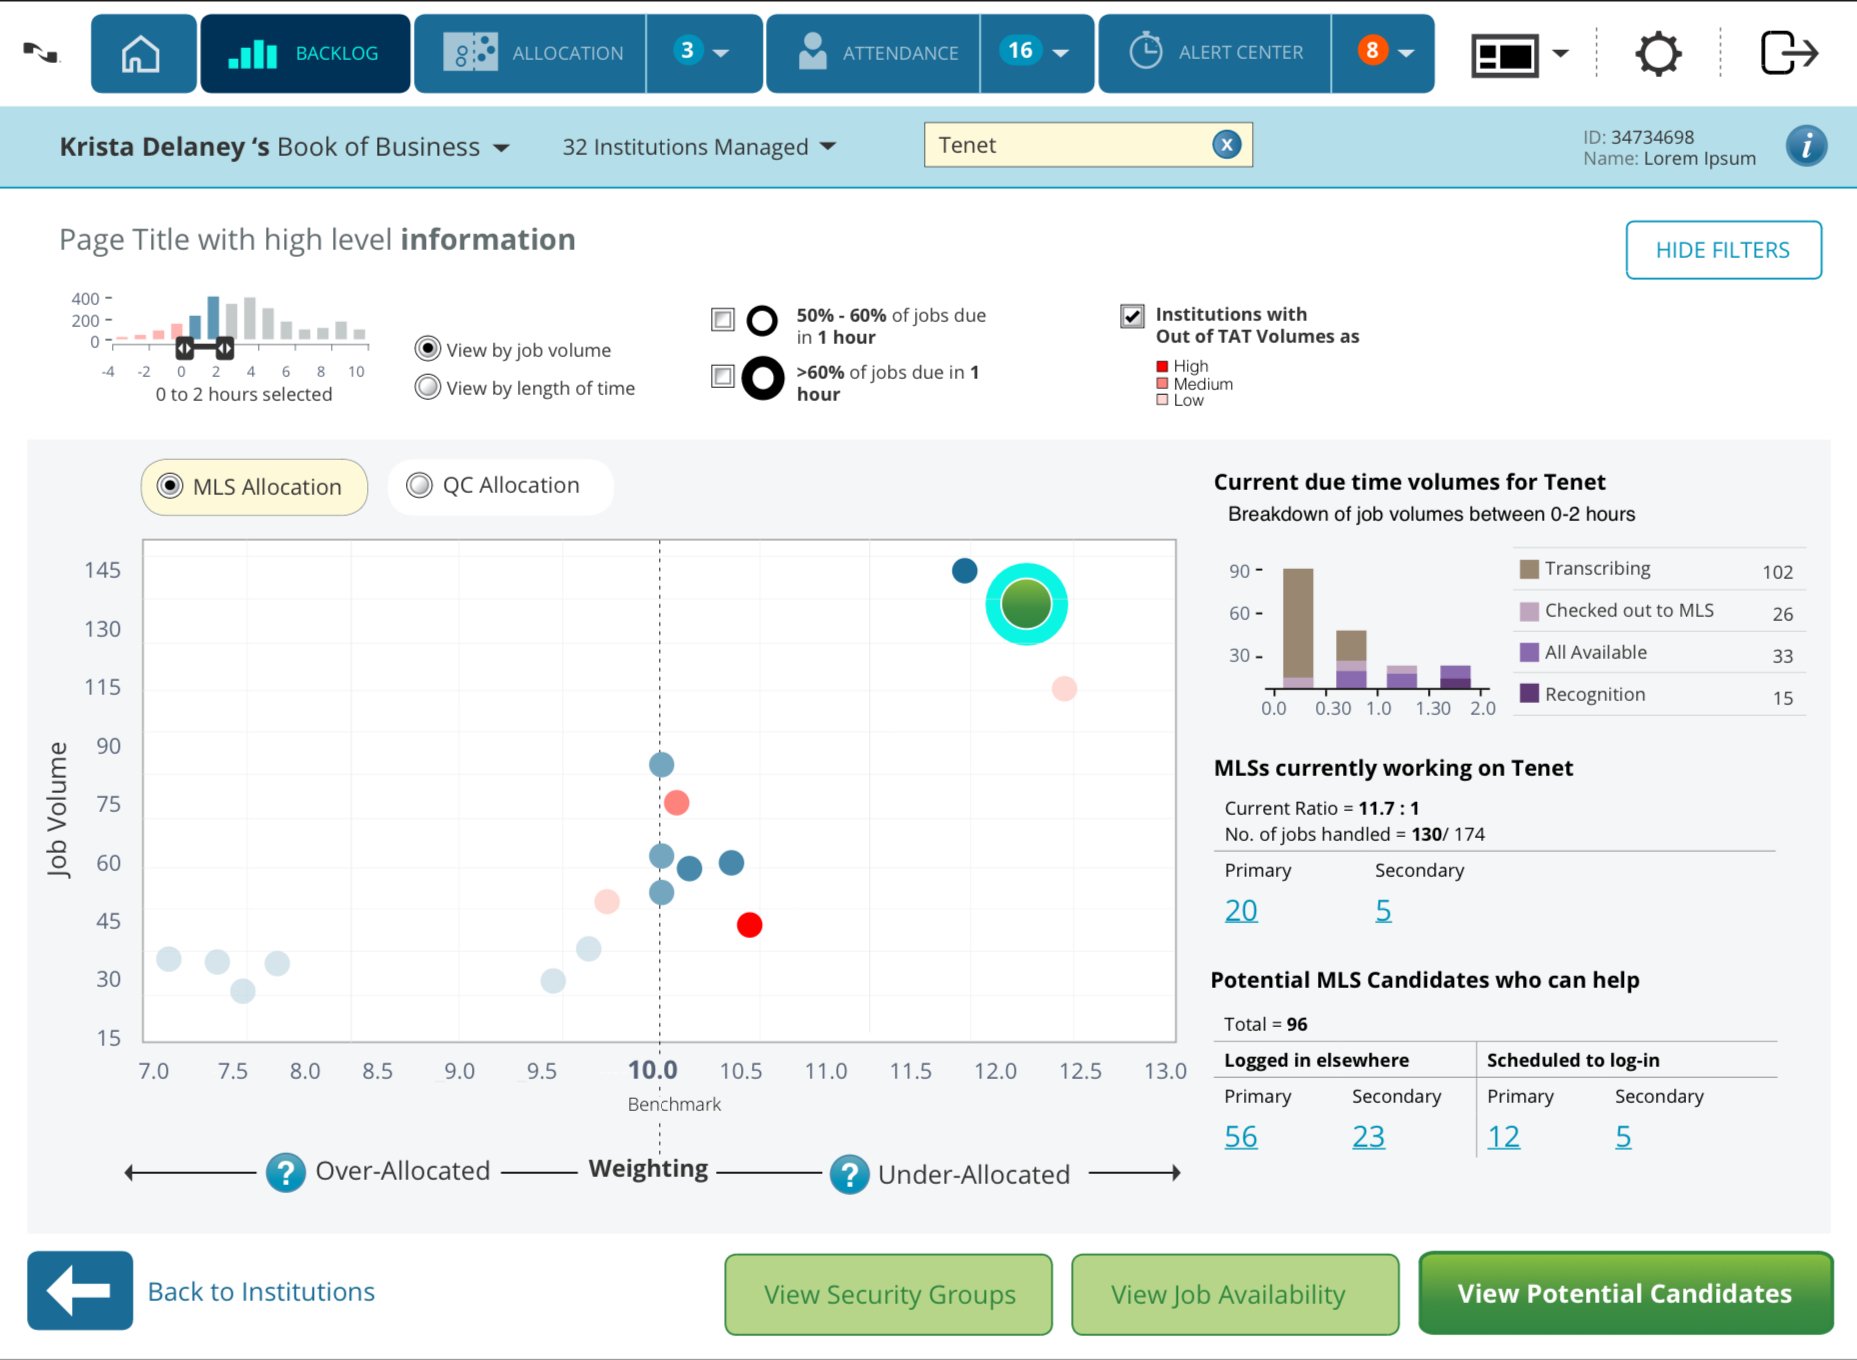
Designed a real-time data dashboard to monitor all medical transcription jobs across multiple large and medium accounts in hospital systems.
Outcome: A highly visual design interface that considerably increased speed of processing jobs as turn around times and volume of late jobs were easily detected, leading to more proactive course correction and capacity planning.
Tools used: Low-fidelity sketches, Adobe Illustrator, Adobe XD
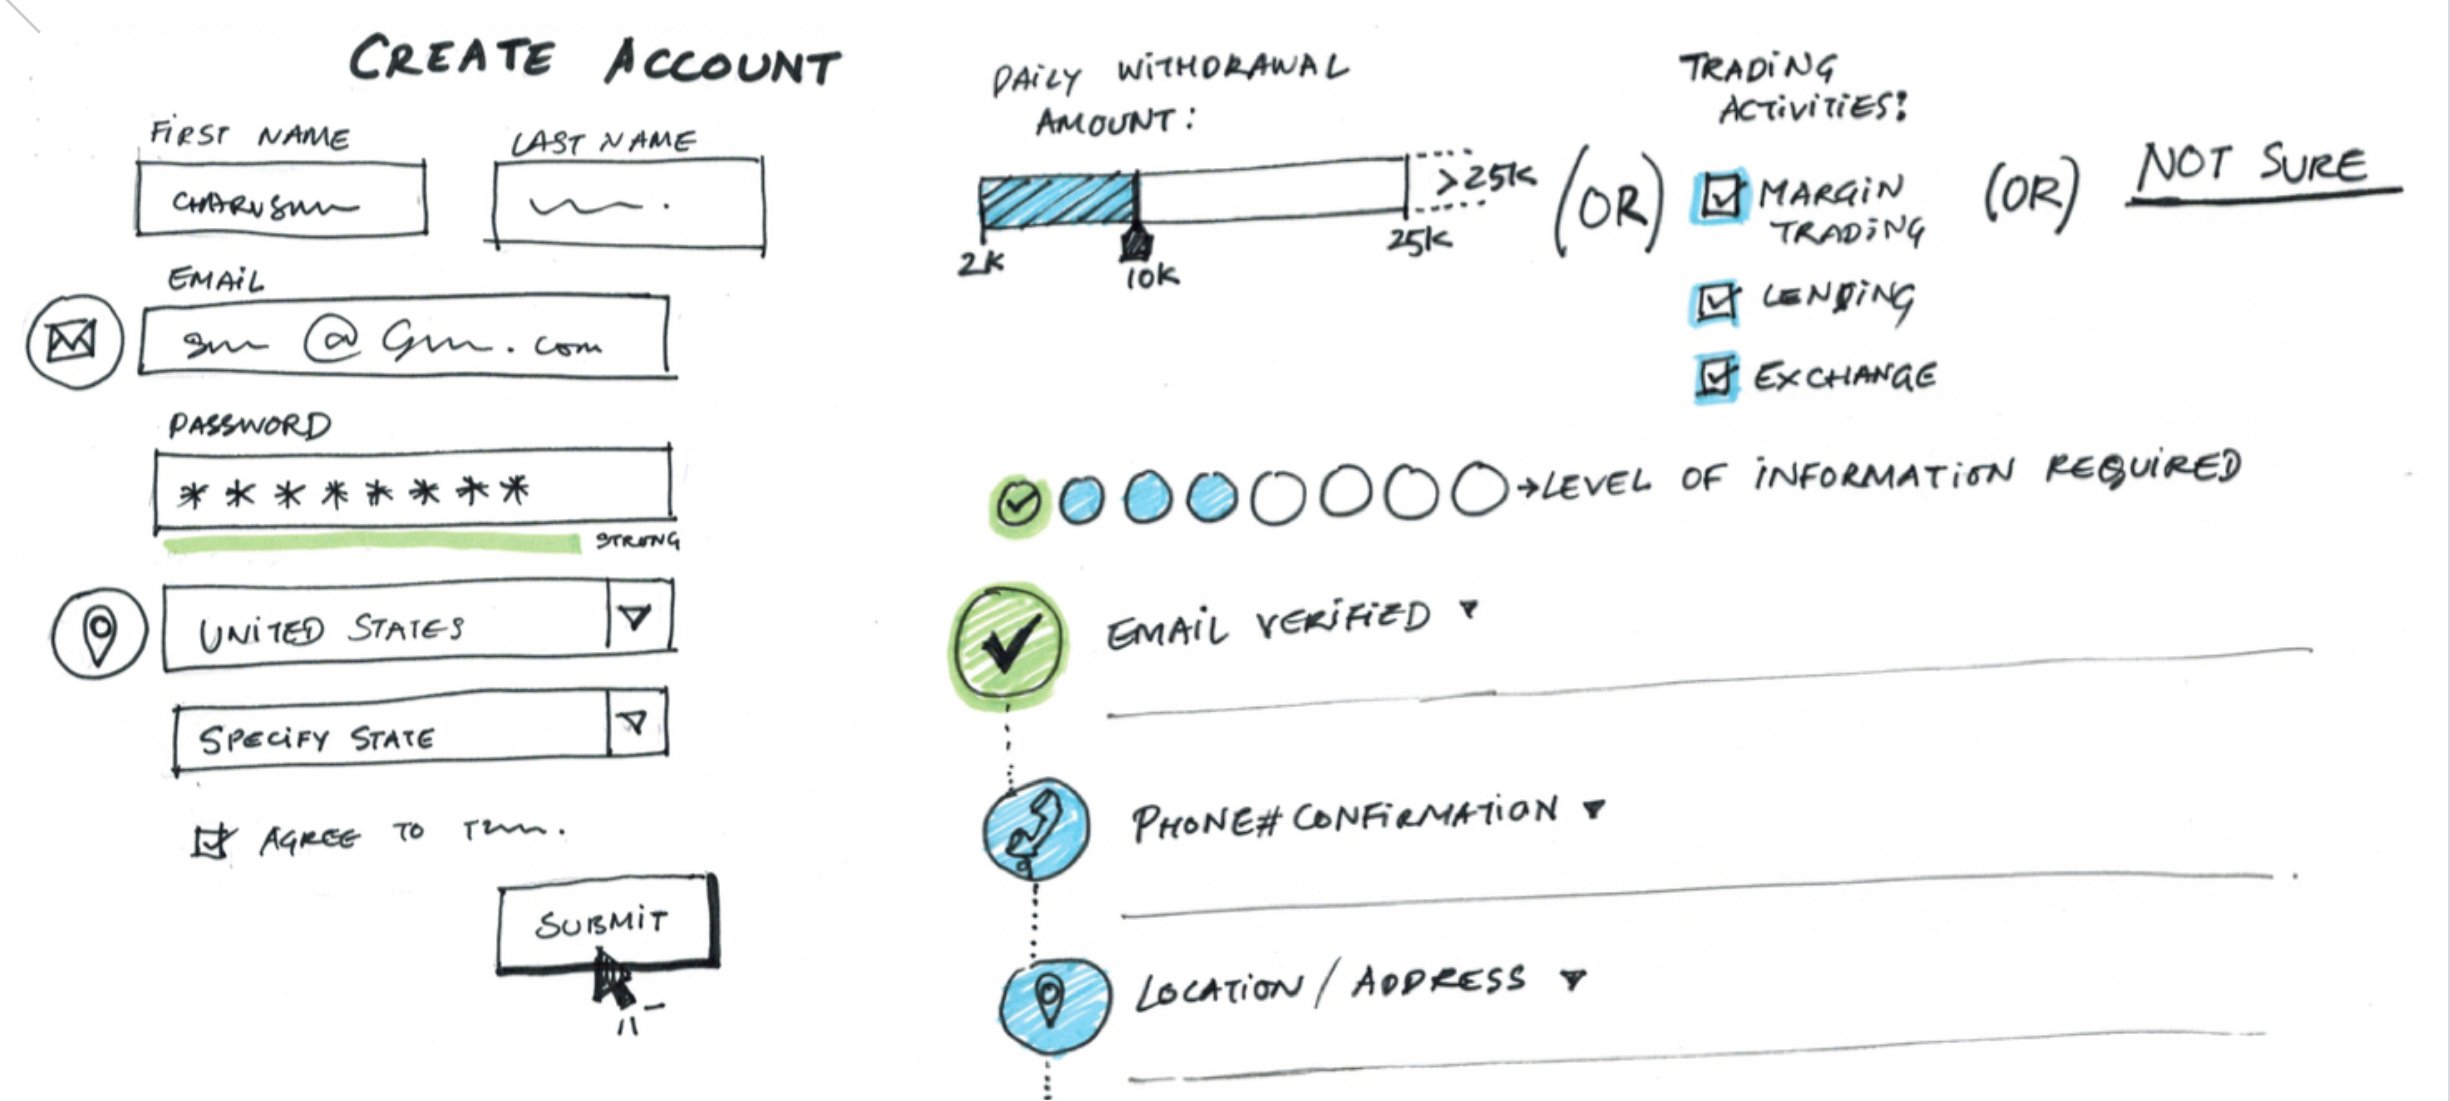
Registration process for cryptocurrency exchange
Type: Transactional process
Role: Interaction Design
Industry: Financial services
Company: Poloniex
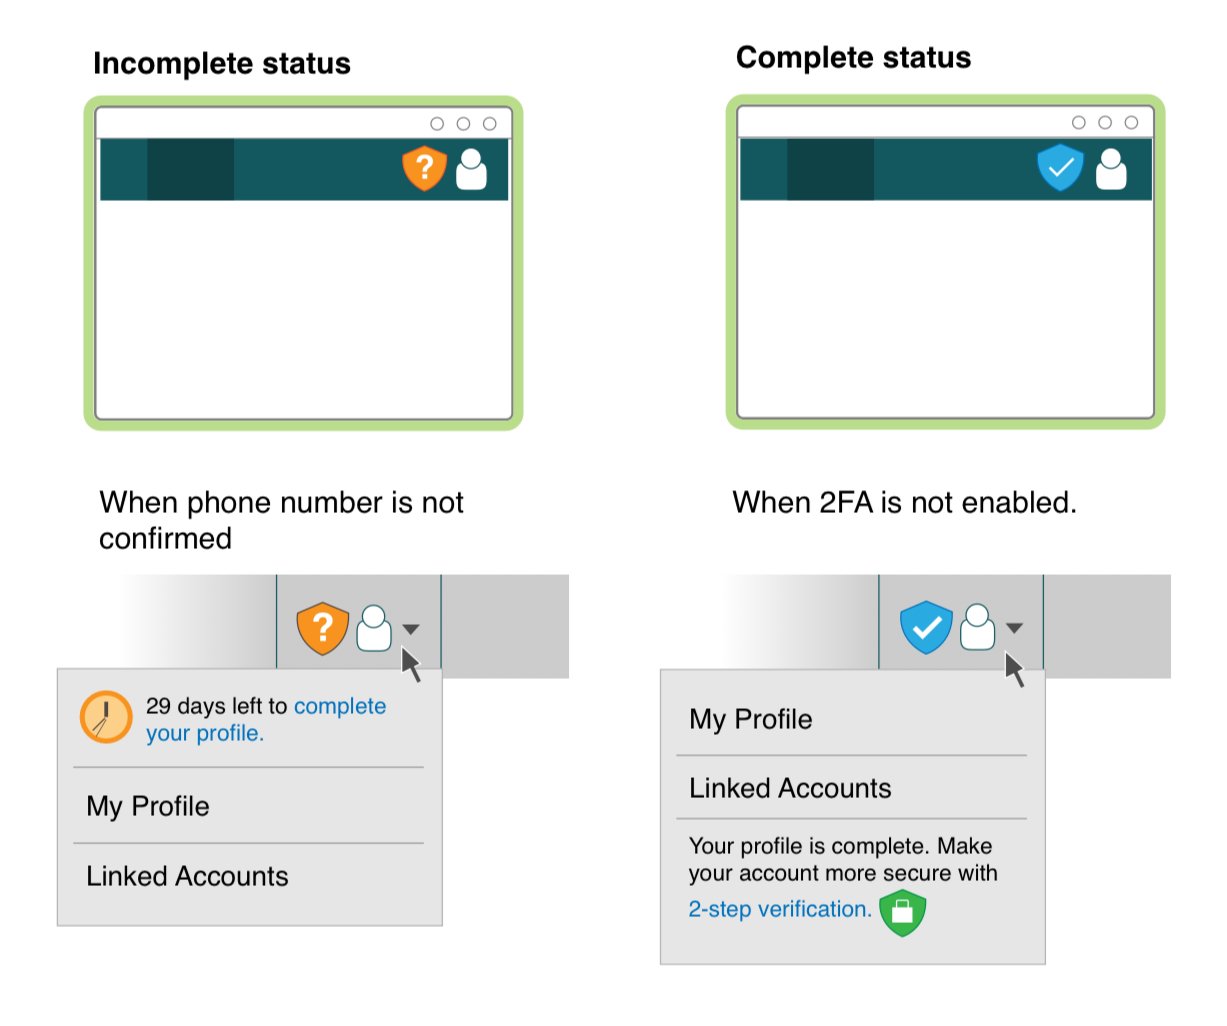
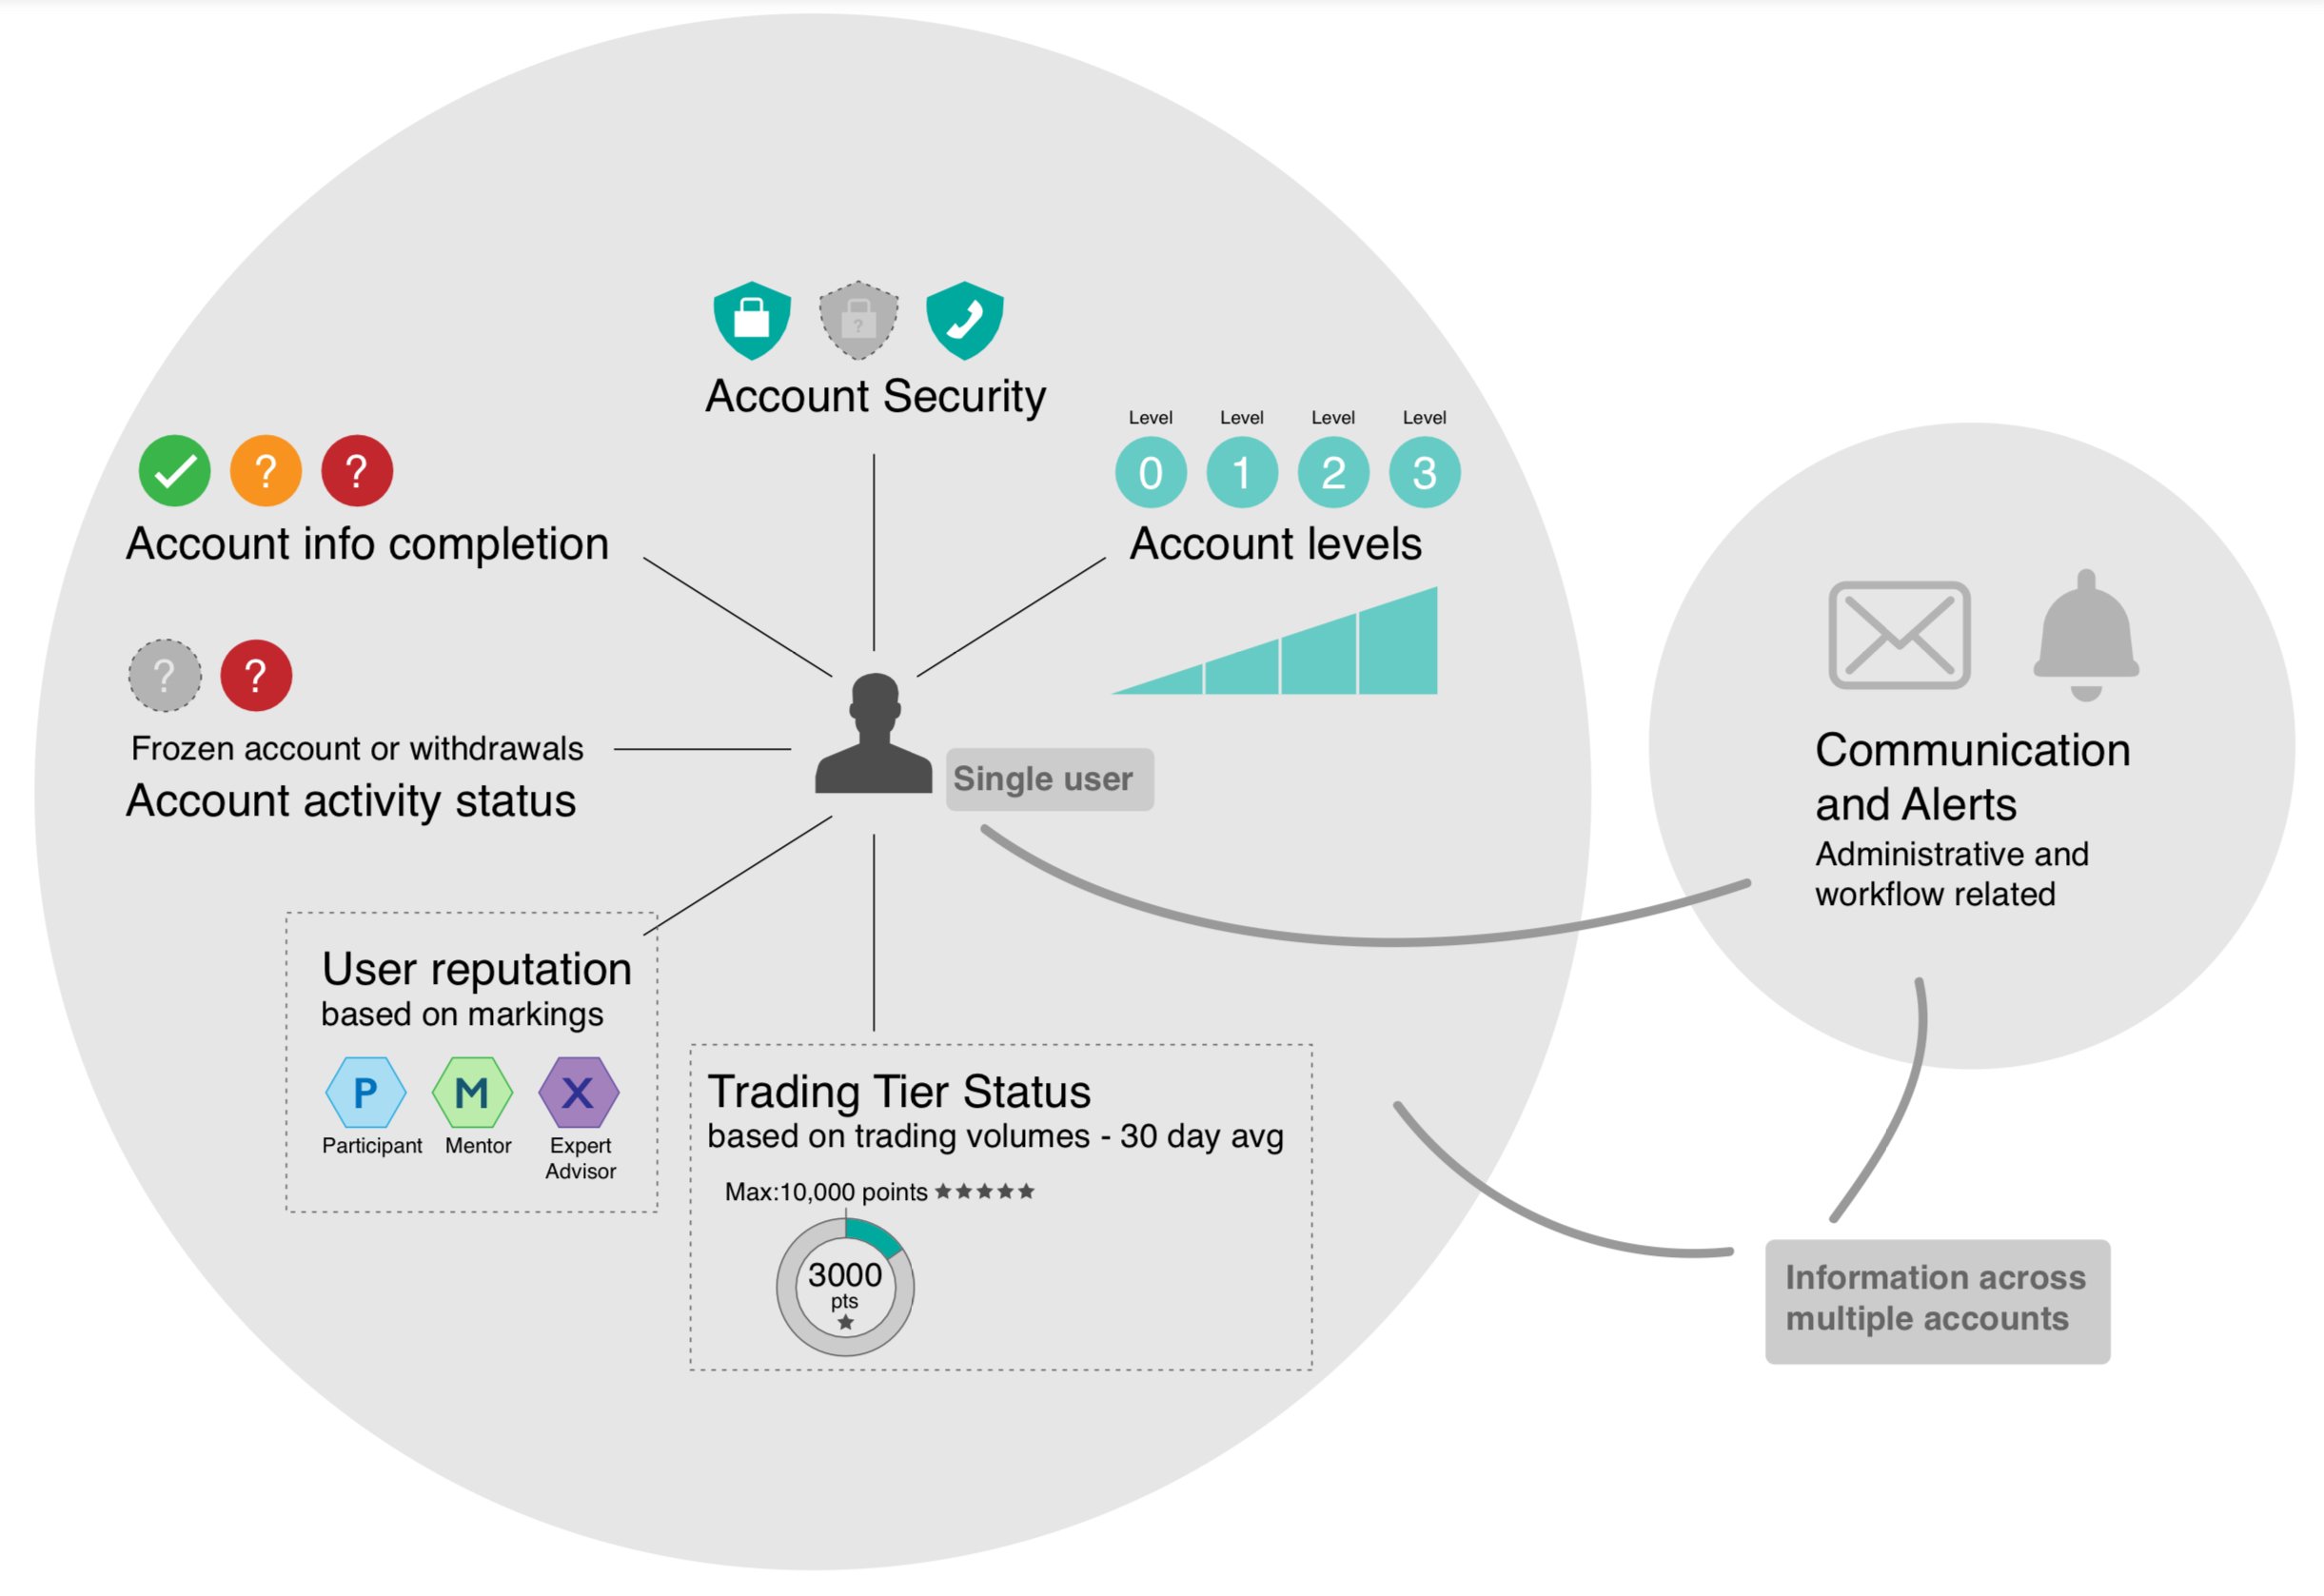
Designed a process to incorporate new industry requirements and policy changes for KYC (Know Your Customer) data while supporting legacy upgrades.
Outcome: 600+% growth in user base in a span of 3-4 months. Helped implement the changes in 3 phases with minimal disruption to legacy users.
Tools used: Low-fidelity sketches, Adobe Illustrator, Proto.io
Feasibility study for Clinical trial
Type: Report
Role: User Research
Industry: Pharma/ Healthcare
Company: Vertex/ Patients Like Me
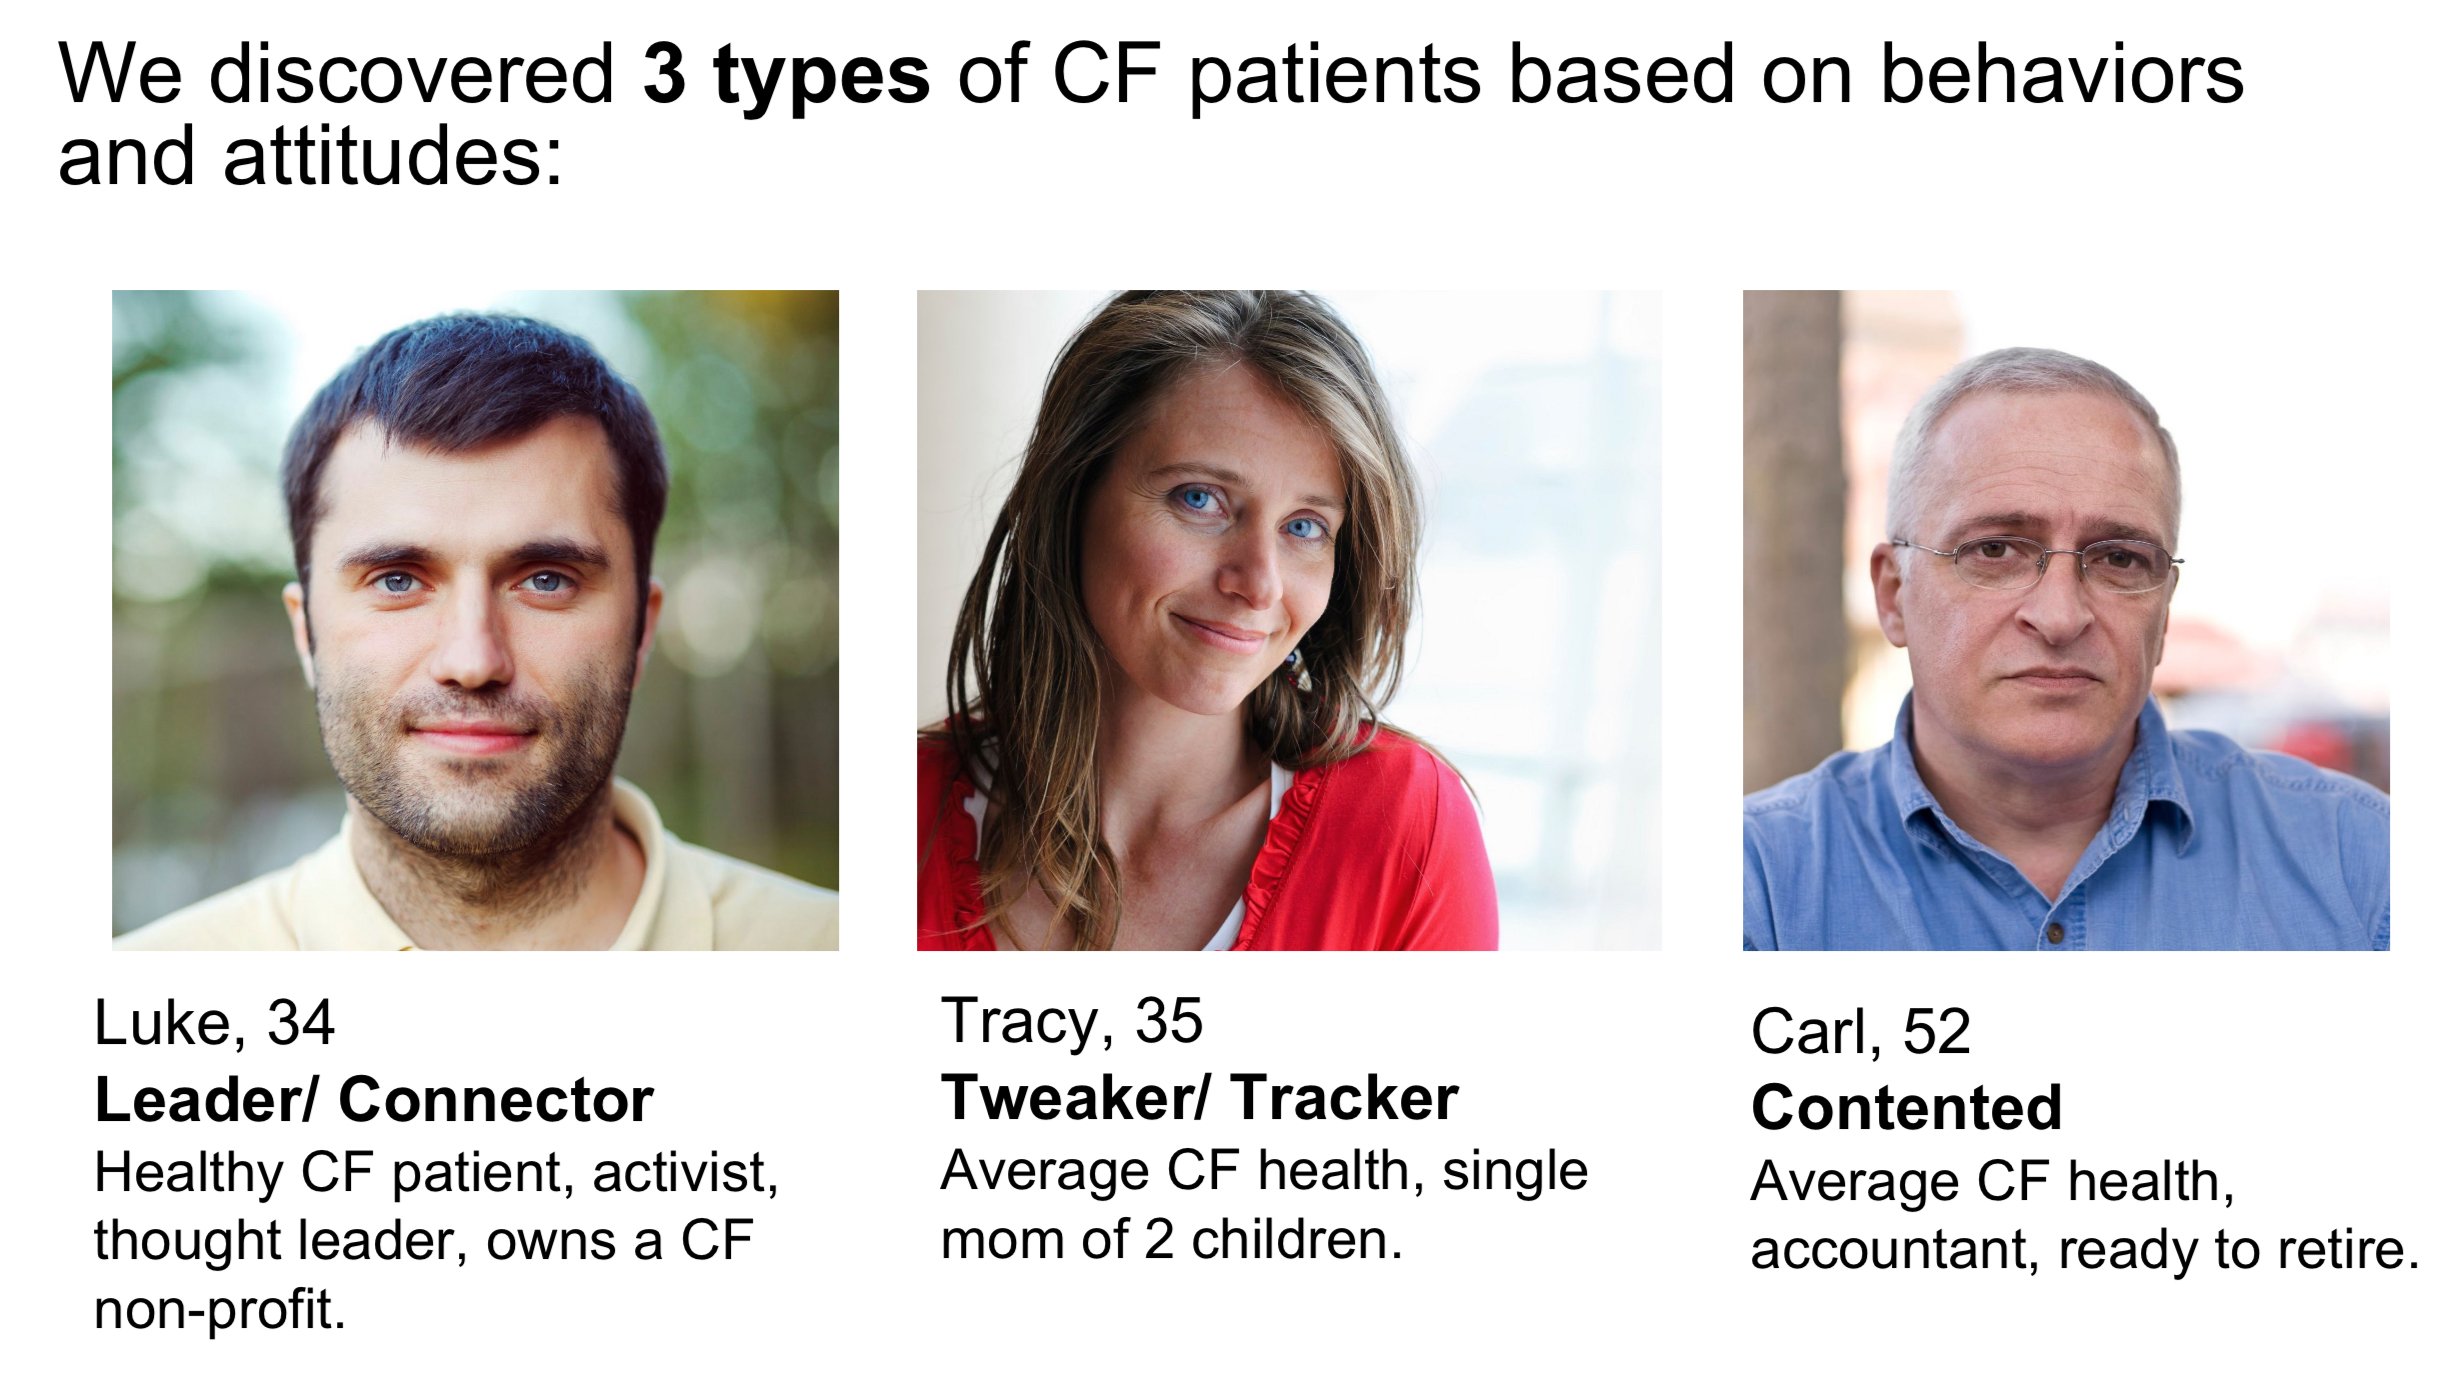
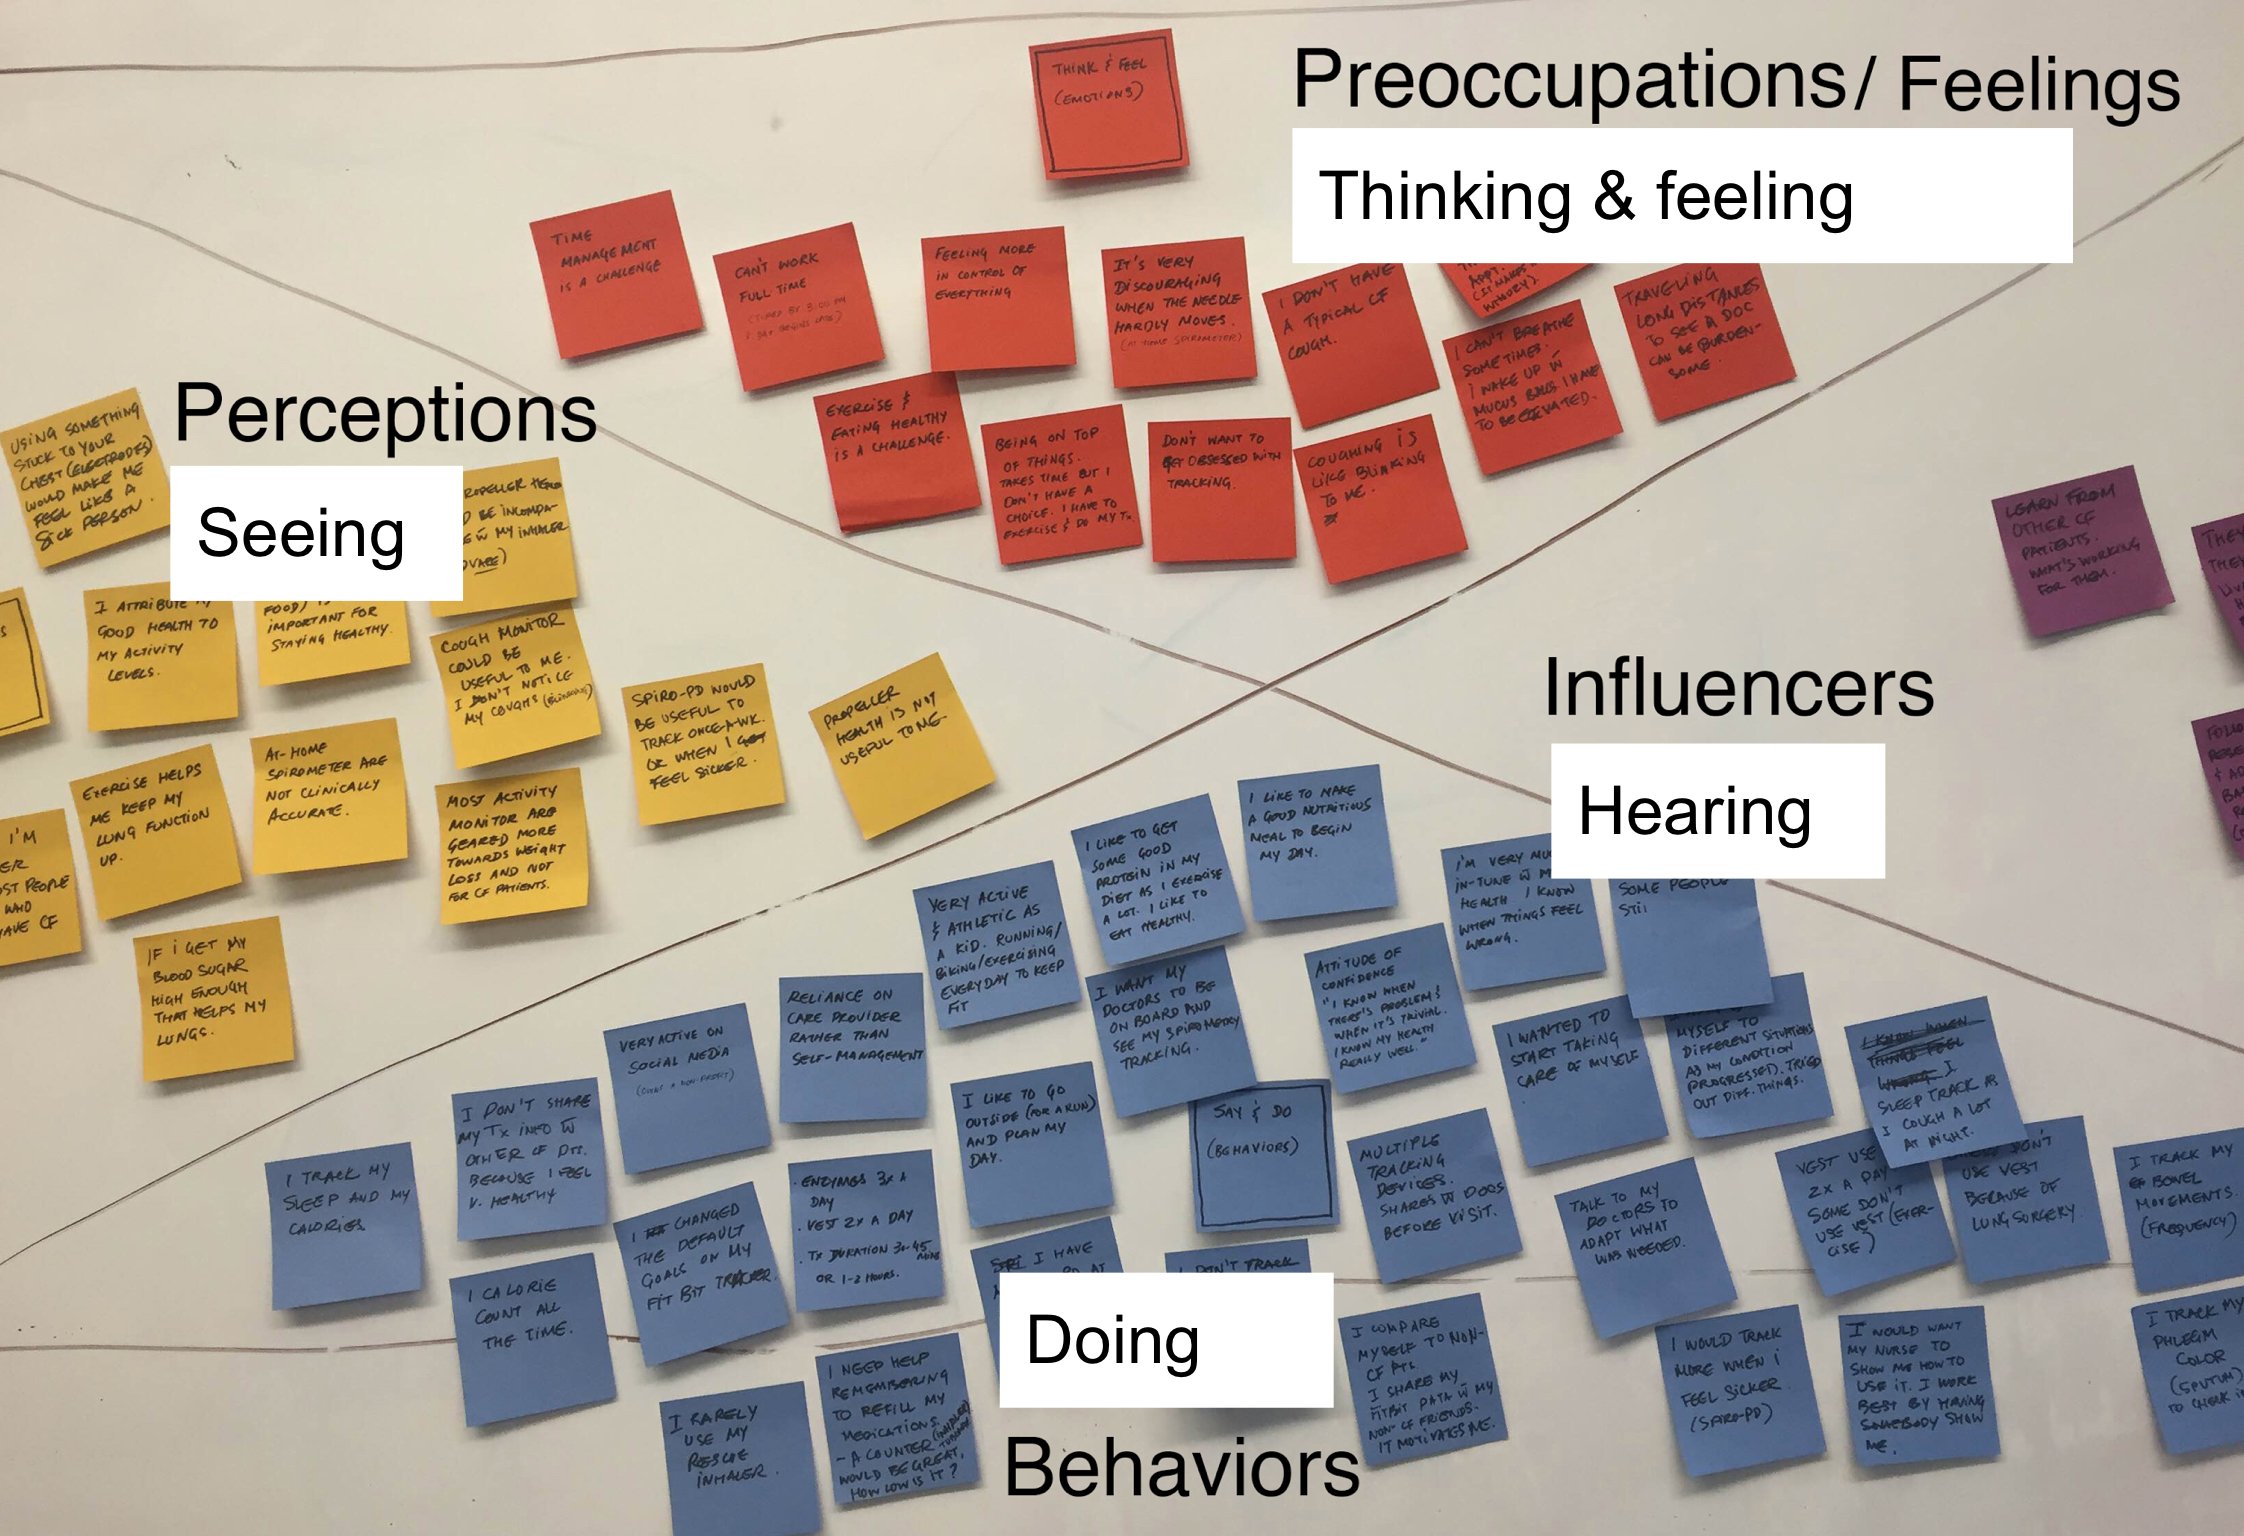
Conducted and synthesized data from a series of interviews to understand the challenges of patients living with cystic fibrosis and guide the selection of wearable medical device(s) and trackers amongst patients on clinical trial.
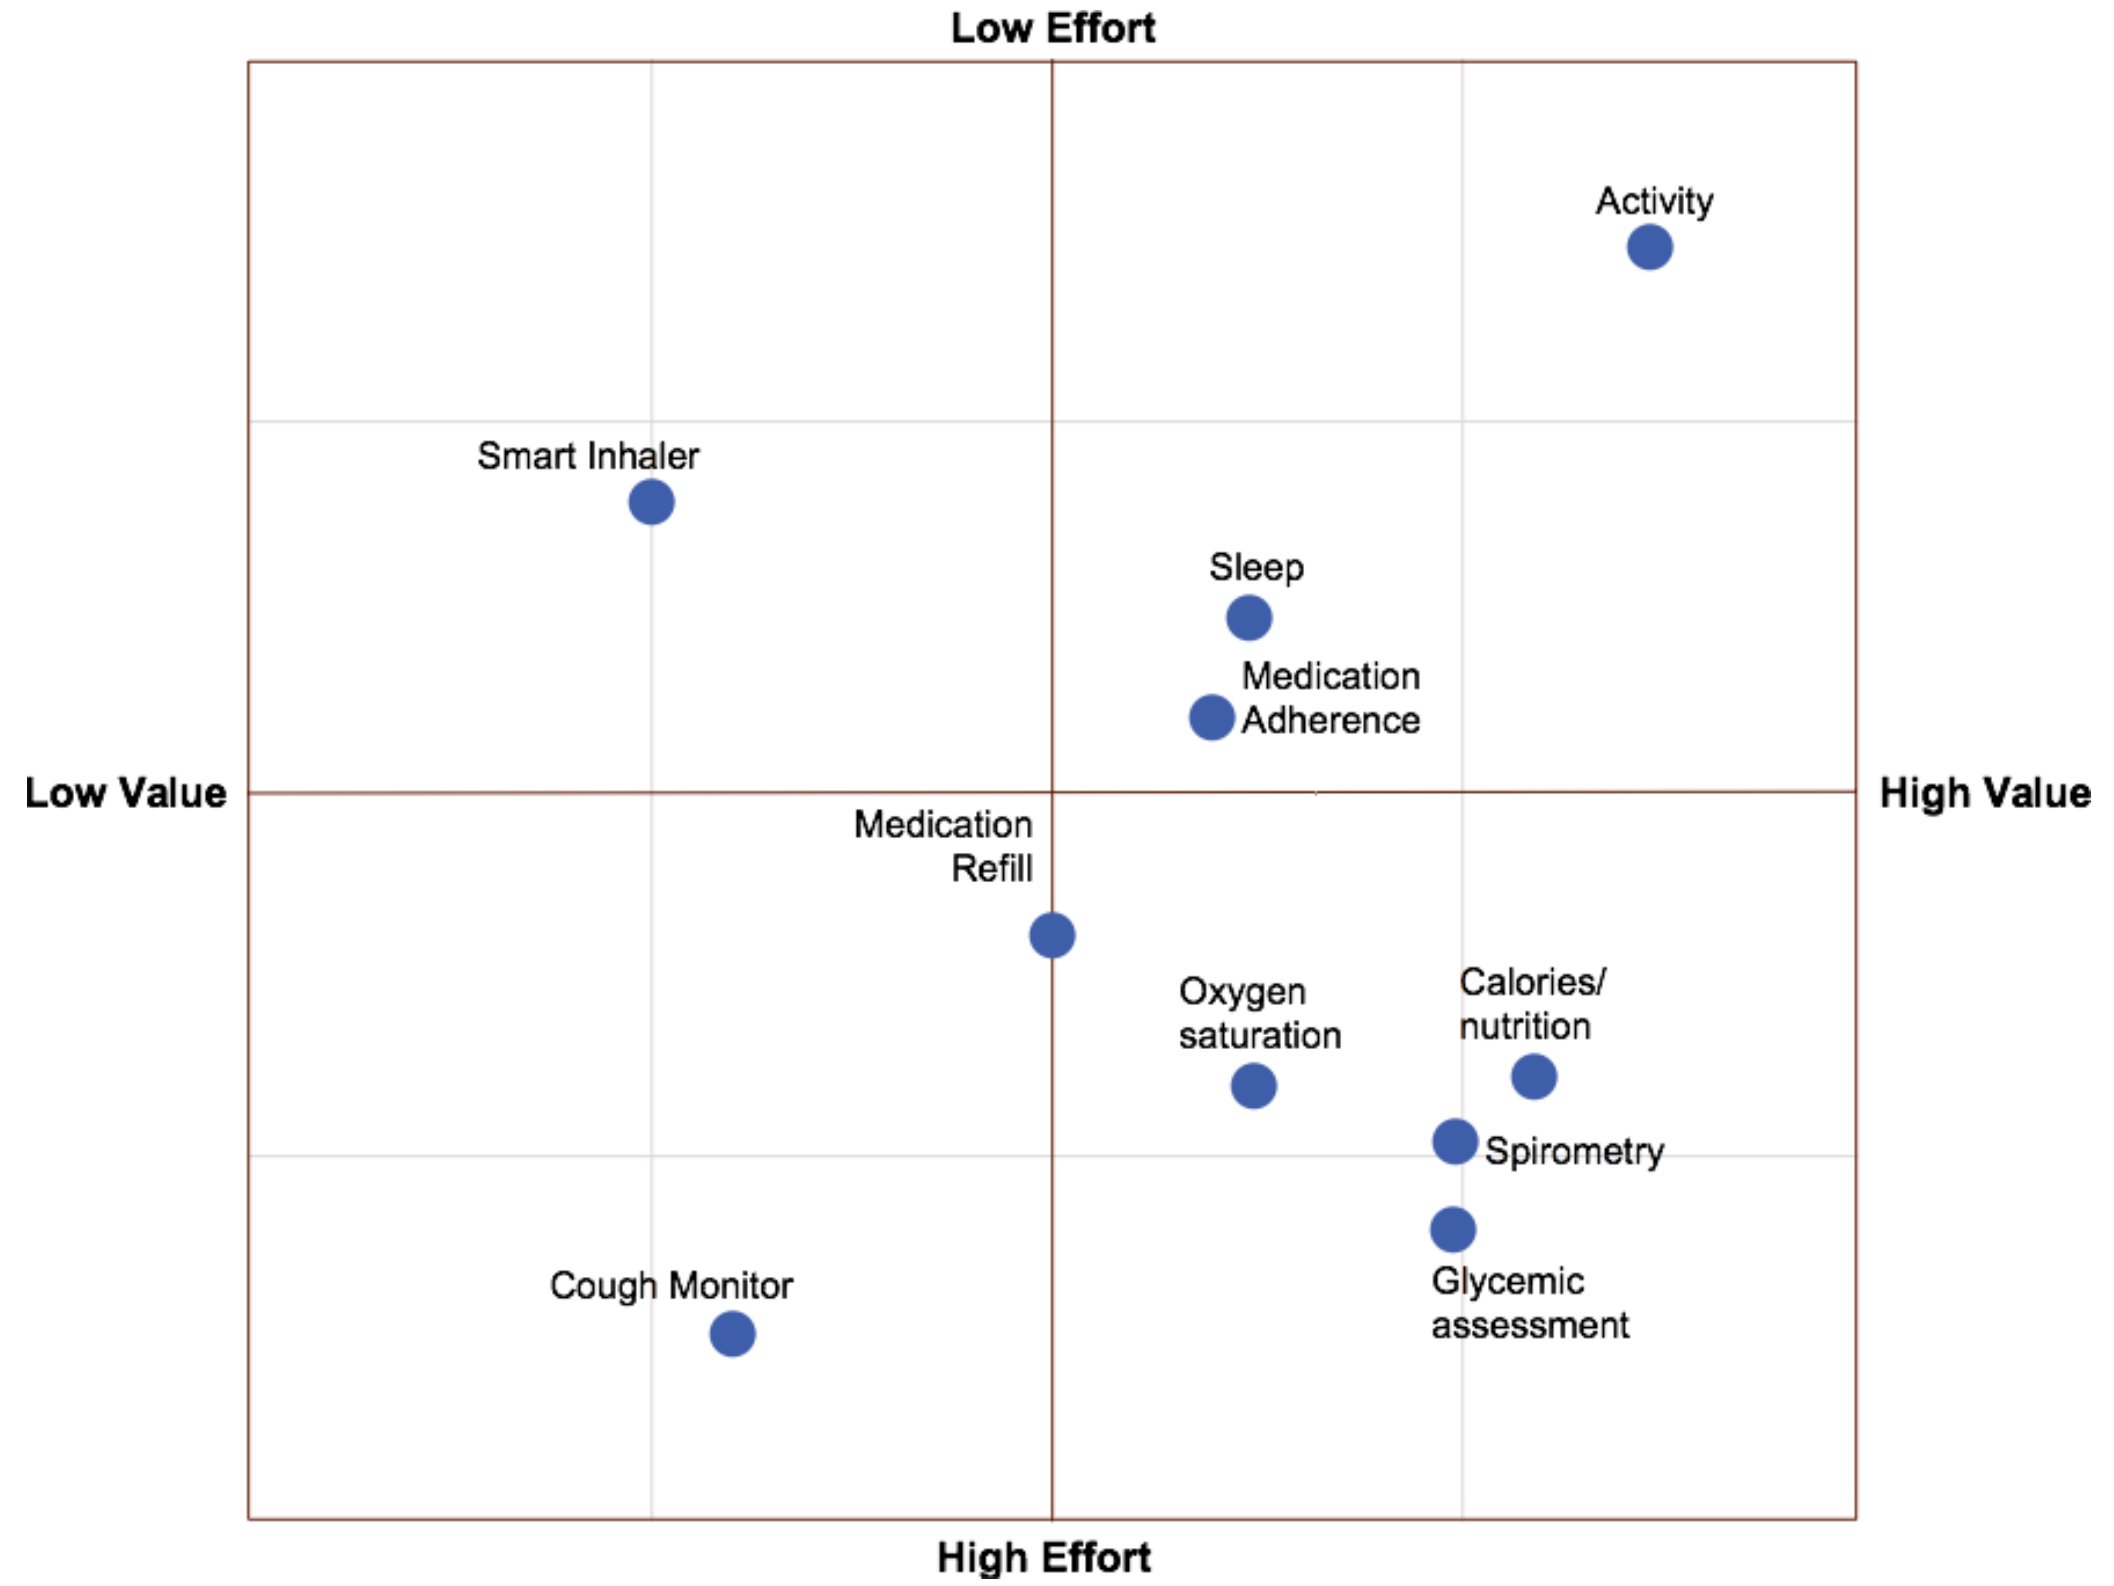
Outcome: Discovered unmet needs in health data tracking. Several trackers were plotted against a scale of value vs. effort to guide usage/ adoption.
Tools used: Sticky notes, Sharpies, Powerpoint
